Server: Reactive programming II
- Learning outcomes
- Become familiar with reactive functions and observers
- Understand how to change the UI reactively through updaters
- Control the reactive graph through events, isolation, and truthiness
- Let Shiny’s reactive flow work for, not against you
1 Basics
- In the last section, you learned about what reactivity means in Shiny
- Recall:
- The programmer provides R with a “recipe”
- R creates an order of expressions under the hood (or “reactive graph”)
- R executes these expressions whenever an input changes
- So far we have worked with inputs (e.g.
input$slider), outputs (e.g.output$plot), and reactive functions (e.g.reactive(input$slider + 1)) - In a Shiny app, these three elements are by far the most widely used
- In this section, you will learn about new mechanisms to control the reactive graph:
- Observers: Reactively perform side effects
- Updaters: Change inputs
- Events: Control when reactive elements are executed
- Isolation: Sever expressions from the reactive graph
- Truthiness: Stop reactivity based on arbitrary conditions
2 Overview of the reactivity workflow
- This workflow chart is an overview of the most important mechanisms of Shiny’s server function
- We do not address all elements on this map, but at the end of the workshop you should get the general idea of what is going on here

3 Reactives versus observers
3.1 Reactive
- Reactives (
reactive()) wrapped up:- Reactives wrap an R expression to create a reactive expression
- They “react” to an input, i.e. are evaluated when an input changes.
- They are both reactive producers and consumer. They take reactive values and return a reactive value.
- They must be assigned to a name. They can be referred to by other reactive consumers by being called like a function.
- They are evaluated lazily, i.e. they only run if they are forced to, for example when they are called by another reactive.
- They are cached, i.e. when called back-to-back, without any dependency changing, then they return the same value twice
- Reactives have two clear uses:
- They reduce the amount of computation that needs to be done by Shiny
- They reduce the mental strain in trying to understand complex Shiny code
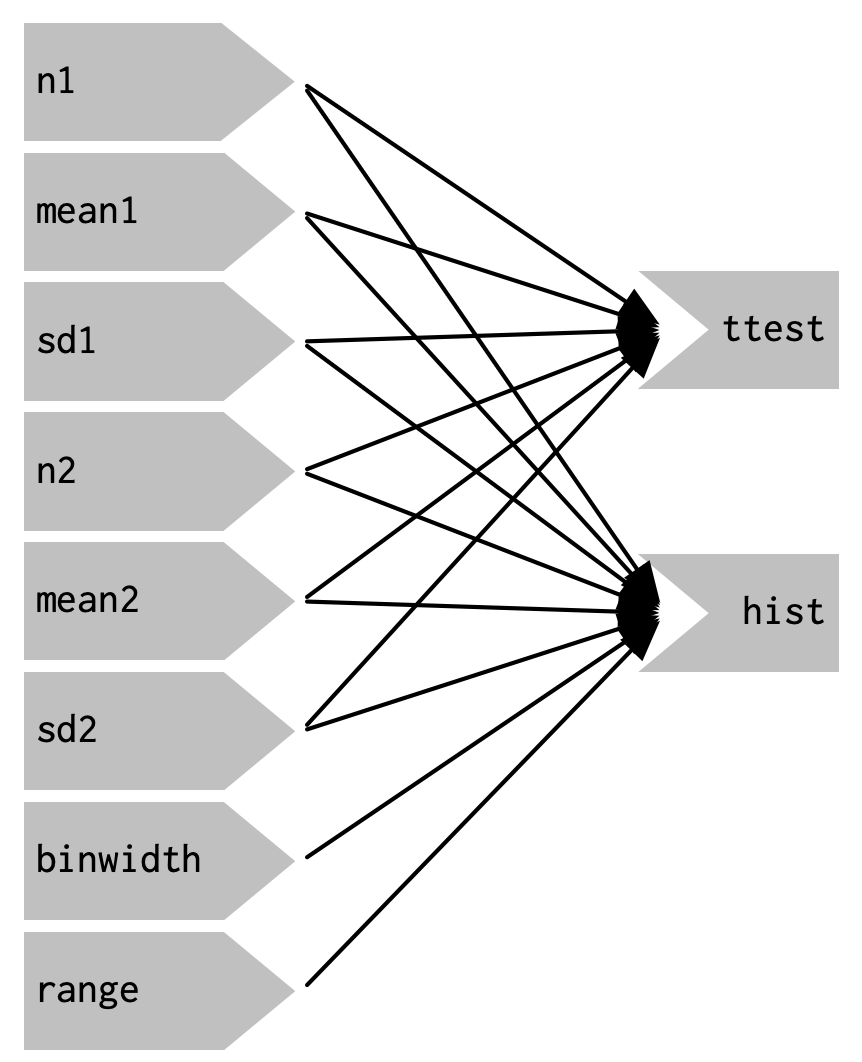
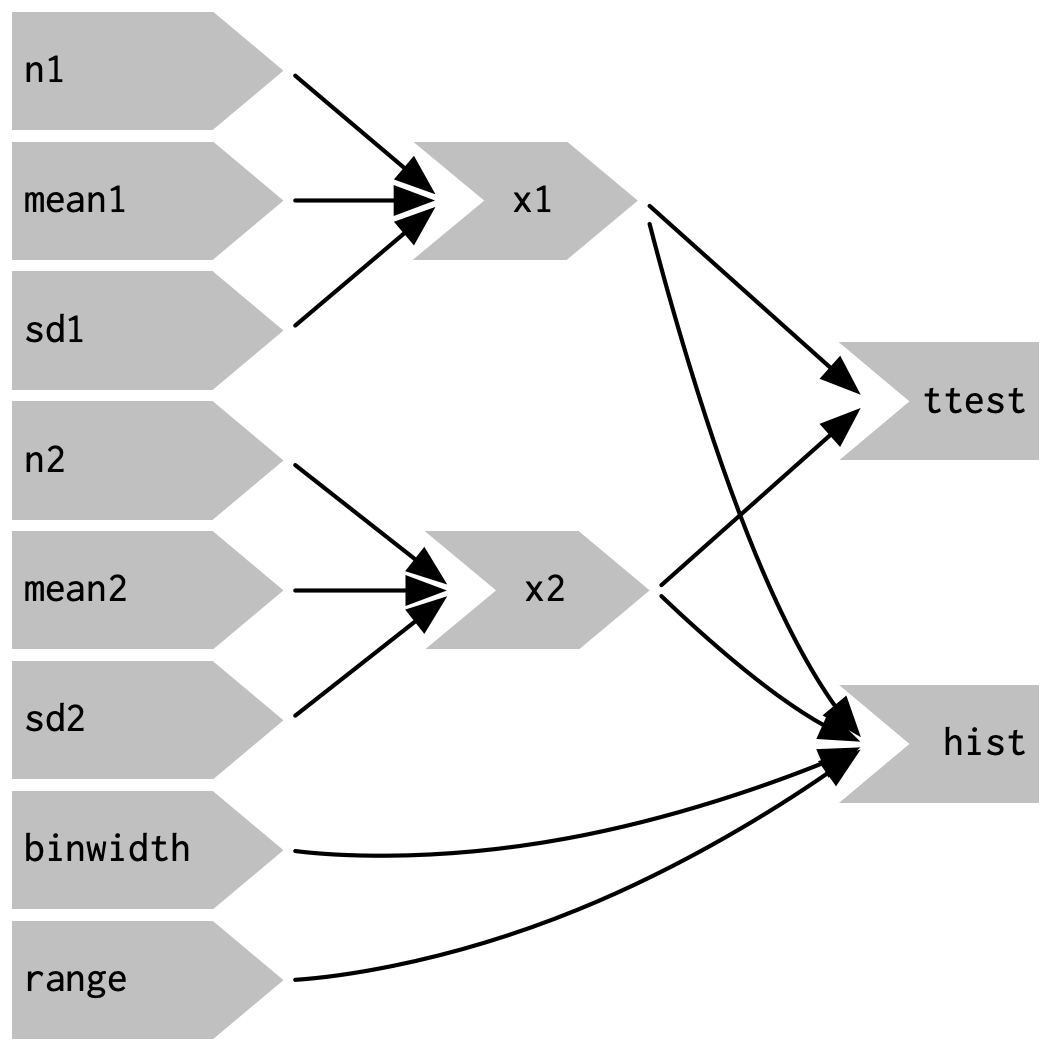
Conceptually and technically, reactives may be compared to traditional R functions. Functional programming follows the “rule of three”: If code would be duplicated three times, wrap it in a function. Shiny follows the rule of two. This is because reactives not only simplify code for humans but also for machines: R only evaluates reactives if it has to. This can dramatically speed up an application.
Also, reactives literally are functions:
|
|
|
|---|---|---|
| Reactive graph without reactives | Reactive graph with reactives |
3.2 Observers
- Observers (
observe()) are similar to reactives:- They also take an arbitrary R expression.
- They also react to an input.
- But they also carry important differences:
- They are not assigned to a name, thus they cannot be referred to from other reactive consumers and their return value is simply discarded. This also means they are terminal nodes (reactive consumers) in the reactive graphs – just like outputs.
- They are evaluated eagerly, i.e. they run as soon as possible and do not wait for their dependencies.
- They are forgetful, their previous output is not cached.
- Since they are terminal nodes but do not produce a visible output, they are something between a reactive and an output
- Their uses are manifold, but here are some examples:
- Logging to the R console
- Updating inputs (see below)
- Reactively changing the UI
- Communicating with a remote storage (e.g. a database or a cloud)
- Essentially everything that does not require assigning to a name
Conceptually, observers may be compared to the tidyverse function purrr::walk, which iterates over a list or a vector and performs “side-effects” like writing to files. Unlike purrr::walk, though, observe is probably much more common-place.
# the reactive takes the inputs and produces a reactive value
# which can be re-used in other reactive expressions
filtered <- reactive({
  xvar <- input$xvar
  yvar <- input$yvar
  range <- input$range

  # select country
  if (!is.null(input$countries)) {
    ess <- ess[ess$country %in% input$countries, ]
  }

  # select variable
  ess[c("idno", "country", xvar, yvar)]
})

# the plot output is a "reactive consumer" that takes
# the reactive value and makes a plot out of it
output$plot <- renderPlot({
  xvar <- input$xvar
  yvar <- input$yvar
  plot_data <- filtered() %>%
    drop_na() %>%
    mutate(across(where(is.numeric), .fns = as.ordered))

  ggplot(plot_data) +
    aes(x = .data[[xvar]], y = .data[[yvar]], group = .data[[xvar]]) +
    geom_violin(fill = "lightblue", show.legend = FALSE) +
    theme_classic()
})

# the observer also takes the reactive value and prints it to the console
# it is also a reactive consumer and does not return anything
observe({
  print(filtered())
})
Complete code
library(dplyr)
library(tidyr)
library(shiny)
library(plotly)
library(leaflet)
library(haven)

ess <- readRDS("ess_trust.rds")
ess_geo <- readRDS("ess_trust_geo.rds")

# UI ----
ui <- fluidPage(
  titlePanel("European Social Survey - round 10"),

  ## Sidebar ----
  sidebarLayout(
    sidebarPanel(
      ### select dependent variable
      selectInput(
        "xvar",
        label = "Select a dependent variable",
        choices = c(
          "Trust in country's parliament" = "trust_parliament",
          "Trust in the legal system" = "trust_legal",
          "Trust in the police" = "trust_police",
          "Trust in politicians" = "trust_politicians",
          "Trust in political parties" = "trust_parties",
          "Trust in the European Parliament" = "trust_eu",
          "Trust in the United Nations" = "trust_un"
        )
      ),

      ### select a variable ----
      selectInput(
        "yvar",
        label = "Select an independent variable",
        choices = c(
          "Placement on the left-right scale" = "left_right",
          "Age" = "age",
          "Feeling about household's income" = "income_feeling",
          "How often do you use the internet?" = "internet_use",
          "How happy are you?" = "happiness"
        )
      ),

      ### select a country ----
      selectizeInput(
        "countries",
        label = "Filter by country",
        choices = unique(ess$country),
        selected = "FR",
        multiple = TRUE
      )
    ),

    ## Main panel ----
    mainPanel(
      tabsetPanel(
        type = "tabs",

        ### Table tab ----
        tabPanel(
          title = "Table",
          div(
            style = "height: 600px; overflow-y: auto;",
            tableOutput("table")
          )
        ),

        ### Plot tab ----
        tabPanel(
          title = "Plot",
          plotOutput("plot", height = 600)
        )
      )
    )
  )
)


# Server ----
server <- function(input, output, session) {
  # filter data ----
  filtered <- reactive({
    xvar <- input$xvar
    yvar <- input$yvar
    range <- input$range

    # select country
    ess <- ess[ess$country %in% input$countries, ]

    # select variable
    ess[c("idno", "country", xvar, yvar)]
  })

  # render table ----
  output$table <- renderTable({
    filtered()
  }, height = 400)

  # render plot ----
  output$plot <- renderPlot({
    xvar <- input$xvar
    yvar <- input$yvar
    plot_data <- filtered() %>%
      drop_na() %>%
      mutate(across(where(is.numeric), .fns = as.ordered))

    ggplot(plot_data) +
      aes(x = .data[[xvar]], y = .data[[yvar]], group = .data[[xvar]]) +
      geom_violin(fill = "lightblue", show.legend = FALSE) +
      theme_classic()
  })

  # executes everytime `filtered()` is updated
  # prints the filtered dataset to the console
  observe({
    print(filtered())
  })
}

shinyApp(ui = ui, server = server)
4 Events
- We talk about an event when a reactive expression is triggered
- For example:
- A user clicks a button
- The Shiny session initializes
- An input is updated (see below)
- We are dealing with Shiny events all the time, but it is important to realize how to control them
4.1 bindEvent
- The
bindEventfunction binds a reactive expression to one or multiple events - The reactive expression is evaluated if and only if the event is triggered
bindEventlocks up a reactive expression unless a specific event is triggered- You can use
bindEventon all sorts of reactive expressions: reactives, observers, and output renderers
4.2 Arguments to bindEvent
bindEventtakes three arguments:ignoreNULL: By default, every event is an event, even if it isNULL. An unpressed button would then also count as an event. If you need your plot to render only before pressing that button, then ignoringNULLis the right choice.ignoreInit: By default, events are triggered when the reactive expressions are first initialized. This can be bad news for dynamically created UI elements (which are beyond this workshop).once: If used on an observer, this argument can be used to destroy that observer after its first use.
4.3 Example
- To exemplify we will add an action button, that serves the following role:
- If the inputs are changed, nothing should happen to the plot
- Only if the button is pressed, shall the plot data be recalculated
In the UI:
In the server function:
filtered <- reactive({
xvar <- input$xvar
yvar <- input$yvar
range <- input$range
# select country
if (!is.null(input$countries)) {
ess <- ess[ess$country %in% input$countries, ]
}
# select variable
ess[c("idno", "country", xvar, yvar)]
}) %>%
bindEvent(input$button, ignoreNULL = FALSE)
output$plot <- renderPlot({
plot_data <- filtered() %>%
drop_na() %>%
mutate(across(where(is.numeric), .fns = as.ordered))
xvar <- names(plot_data)[[3]]
yvar <- names(plot_data)[[4]]
ggplot(plot_data) +
aes(x = .data[[xvar]], y = .data[[yvar]], group = .data[[xvar]]) +
geom_violin(fill = "lightblue", show.legend = FALSE) +
theme_classic()
})Complete code (important lines are highlighted)
library(dplyr)
library(tidyr)
library(shiny)
library(plotly)
library(leaflet)
library(haven)
ess <- readRDS("ess_trust.rds")
ess_geo <- readRDS("ess_trust_geo.rds")
# UI ----
ui <- fluidPage(
titlePanel("European Social Survey - round 10"),
## Sidebar ----
sidebarLayout(
sidebarPanel(
### select dependent variable
selectInput(
"xvar",
label = "Select a dependent variable",
choices = c(
"Trust in country's parliament" = "trust_parliament",
"Trust in the legal system" = "trust_legal",
"Trust in the police" = "trust_police",
"Trust in politicians" = "trust_politicians",
"Trust in political parties" = "trust_parties",
"Trust in the European Parliament" = "trust_eu",
"Trust in the United Nations" = "trust_un"
)
),
### select a variable ----
selectInput(
"yvar",
label = "Select an independent variable",
choices = c(
"Placement on the left-right scale" = "left_right",
"Age" = "age",
"Feeling about household's income" = "income_feeling",
"How often do you use the internet?" = "internet_use",
"How happy are you?" = "happiness"
)
),
### select a country ----
selectizeInput(
"countries",
label = "Filter by country",
choices = unique(ess$country),
selected = "FR",
multiple = TRUE
),
actionButton(
  "button",
  label = "Update parameters",
  icon = icon("refresh")
)
),
## Main panel ----
mainPanel(
tabsetPanel(
type = "tabs",
### Table tab ----
tabPanel(
title = "Table",
div(
style = "height: 600px; overflow-y: auto;",
tableOutput("table")
)
),
### Plot tab ----
tabPanel(
title = "Plot",
plotOutput("plot", height = 600)
)
)
)
)
)
# Server ----
server <- function(input, output, session) {
# filter data ----
filtered <- reactive({
xvar <- input$xvar
yvar <- input$yvar
range <- input$range
# select country
ess <- ess[ess$country %in% input$countries, ]
# select variable
ess[c("idno", "country", xvar, yvar)]
}) %>%
bindEvent(input$button, ignoreNULL = FALSE)
# render table ----
output$table <- renderTable({
filtered()
}, height = 400)
# render plot ----
output$plot <- renderPlot({
plot_data <- filtered() %>%
drop_na() %>%
mutate(across(where(is.numeric), .fns = as.ordered))
xvar <- names(plot_data)[[3]]
yvar <- names(plot_data)[[4]]
ggplot(plot_data) +
aes(x = .data[[xvar]], y = .data[[yvar]], group = .data[[xvar]]) +
geom_violin(fill = "lightblue", show.legend = FALSE) +
theme_classic()
})
}
shinyApp(ui = ui, server = server)5 Updaters
- Updaters are one of the more common uses of observers
- They update the values and appearance of input widgets
- There are update functions for most input widgets – and if there is not, updating becomes much more difficult
- Some examples:
updateSelectInput: Updating an input selection can update a palette selection to match varying data types – continuous, categorical, divering.updateTabsetPanel: Updating a tabset panel can automatically switch between tabs.updateActionButton: Updating an action button can simulate a button click, without the user needing to physically click on the button.
5.1 Implementation
- Updaters are usually found in an observer.
- Because they often do not depend on any input, they are best coupled with
bindEvent. - It can also be useful to combine them with
freezeReactiveValue- Updating a value triggers an event
- Freezing can prevent the event from triggering twice: when changing the input and when updating.
observe({
freezeReactiveValue(input, "id_of_input")
updateSelectInput(
session = session,
inputId = "id_of_input",
choices = c("a", "b", "c")
selected = "b"
) %>%
bindEvent(input$button)
})- 1
-
Freeze
id_of_inputto prevent it from triggering an event twice, first when clicking on the button, and second when updating the input. - 2
-
The
sessionobject of the server function has to be passed to every update function. This has no deeper meaning. - 3
-
The
inputIdargument takes the ID of the widget that is to be updated - 4
- Every update function has different arguments to alter different parts of the input widget
- 5
- Bind the observer to an input that should trigger the input update
5.2 Example
- To exemplify, we add a new slider to the app:
- Note that min, max, and value are fixed
- …, but the independent variable is not: we can select a different variable with a different range
- We can thus implement an updater that dynamically updates the slider with new ranges:
observe({
yvar <- input$yvar
freezeReactiveValue(input, "slider")
updateSliderInput(
session = session,
inputId = "slider",
min = min(ess[[yvar]], na.rm = TRUE),
max = max(ess[[yvar]], na.rm = TRUE),
value = range(ess[[yvar]], na.rm = TRUE)
)
}) %>%
bindEvent(input$yvar)
filtered <- reactive({
xvar <- input$xvar
yvar <- input$yvar
# select country
ess <- ess[ess$country %in% input$countries, ]
# apply range
ess <- ess[
ess[[yvar]] > input$slider[1] &
ess[[yvar]] < input$slider[2],
]
# select variable
ess[c("idno", "country", xvar, yvar)]
})- 1
- The updater references the ID of the input that needs to change
- 2
- Min, max, and value are adapted to the select Y variable
- 3
- The updater only triggers when a new Y variable is selected
- 4
- The dataset is filtered according to the slider
Complete code (important lines are highlighted)
library(dplyr)
library(tidyr)
library(shiny)
library(plotly)
library(leaflet)
library(haven)
ess <- readRDS("ess_trust.rds")
ess_geo <- readRDS("ess_trust_geo.rds")
# UI ----
ui <- fluidPage(
titlePanel("European Social Survey - round 10"),
## Sidebar ----
sidebarLayout(
sidebarPanel(
### select dependent variable
selectInput(
"xvar",
label = "Select a dependent variable",
choices = c(
"Trust in country's parliament" = "trust_parliament",
"Trust in the legal system" = "trust_legal",
"Trust in the police" = "trust_police",
"Trust in politicians" = "trust_politicians",
"Trust in political parties" = "trust_parties",
"Trust in the European Parliament" = "trust_eu",
"Trust in the United Nations" = "trust_un"
)
),
### select a variable ----
selectInput(
"yvar",
label = "Select an independent variable",
choices = c(
"Placement on the left-right scale" = "left_right",
"Age" = "age",
"Feeling about household's income" = "income_feeling",
"How often do you use the internet?" = "internet_use",
"How happy are you?" = "happiness"
)
),
### select a country ----
selectizeInput(
"countries",
label = "Filter by country",
choices = unique(ess$country),
selected = "FR",
multiple = TRUE
),
sliderInput(
  "slider",
  label = "Select a range for the independent variable",
  min = min(ess$left_right, na.rm = TRUE),
  max = max(ess$left_right, na.rm = TRUE),
  value = range(ess$left_right, na.rm = TRUE),
  step = 1
)
),
## Main panel ----
mainPanel(
tabsetPanel(
type = "tabs",
### Table tab ----
tabPanel(
title = "Table",
div(
style = "height: 600px; overflow-y: auto;",
tableOutput("table")
)
),
### Plot tab ----
tabPanel(
title = "Plot",
plotOutput("plot", height = 600)
)
)
)
)
)
# Server ----
server <- function(input, output, session) {
# filter data ----
filtered <- reactive({
xvar <- input$xvar
yvar <- input$yvar
range <- input$slider
# select country
ess <- ess[ess$country %in% input$countries, ]
# apply range
ess <- ess[
ess[[yvar]] > range[1] &
ess[[yvar]] < range[2],
]
# select variable
ess[c("idno", "country", xvar, yvar)]
})
# render table ----
output$table <- renderTable({
filtered()
}, height = 400)
# render plot ----
output$plot <- renderPlot({
plot_data <- filtered() %>%
drop_na() %>%
mutate(across(where(is.numeric), .fns = as.ordered))
xvar <- names(plot_data)[[3]]
yvar <- names(plot_data)[[4]]
ggplot(plot_data) +
aes(x = .data[[xvar]], y = .data[[yvar]], group = .data[[xvar]]) +
geom_violin(fill = "lightblue", show.legend = FALSE) +
theme_classic()
})
observe({
yvar <- input$yvar
freezeReactiveValue(input, "slider")
updateSliderInput(
session = session,
inputId = "slider",
min = min(ess[[yvar]], na.rm = TRUE),
max = max(ess[[yvar]], na.rm = TRUE),
value = range(ess[[yvar]], na.rm = TRUE)
)
}) %>%
bindEvent(input$yvar)
}
shinyApp(ui = ui, server = server)6 Truthiness
- Truthiness is Shiny’s flavor of logical or boolean values.
- Shiny interprets truthiness much more liberally than base R
- Truthiness answers questions such as:
- Is this value missing or available?
- Has the user provided an answer?
- Has the button been clicked?
- Concretely, a value is truthy unless it is:
FALSENULL- An empty character string (
"") - An empty vector (e.g.
numeric(0)) - A vector full of
NA(e.g.c(NA, NA, NA)) - A vector full of
NAorFALSE(e.g.c(NA, FALSE, NA)) - A try-error (e.g.
try(stop("an error"))) - An unclicked action button
6.1 Required values (req)
- Truthiness is useful for Shiny’s
reqfunction reqis equivalent toifstatements in R with two exceptions:- They test for truthiness (instead of
TRUE/FALSE) - They raise a “silent” exception, i.e. they cancel any ongoing computation without logging or displaying an error
- They test for truthiness (instead of
reqis useful to stop reactive behavior when certain conditions are not met
6.2 Example
- In our Shiny app, we can use req to cancel plotting when no country is specified
selectizeInput, which is used to select a country, returnsNULLwhen no value is specified- Now, if we do not specify a country, the plot simply will not render
Complete code (important lines are highlighted)
library(dplyr)
library(tidyr)
library(shiny)
library(plotly)
library(leaflet)
library(haven)

ess <- readRDS("ess_trust.rds")
ess_geo <- readRDS("ess_trust_geo.rds")

# UI ----
ui <- fluidPage(
  titlePanel("European Social Survey - round 10"),

  ## Sidebar ----
  sidebarLayout(
    sidebarPanel(
      ### select dependent variable
      selectInput(
        "xvar",
        label = "Select a dependent variable",
        choices = c(
          "Trust in country's parliament" = "trust_parliament",
          "Trust in the legal system" = "trust_legal",
          "Trust in the police" = "trust_police",
          "Trust in politicians" = "trust_politicians",
          "Trust in political parties" = "trust_parties",
          "Trust in the European Parliament" = "trust_eu",
          "Trust in the United Nations" = "trust_un"
        )
      ),

      ### select a variable ----
      selectInput(
        "yvar",
        label = "Select an independent variable",
        choices = c(
          "Placement on the left-right scale" = "left_right",
          "Age" = "age",
          "Feeling about household's income" = "income_feeling",
          "How often do you use the internet?" = "internet_use",
          "How happy are you?" = "happiness"
        )
      ),

      ### select a country ----
      selectizeInput(
        "countries",
        label = "Filter by country",
        choices = unique(ess$country),
        selected = "FR",
        multiple = TRUE
      )
    ),

    ## Main panel ----
    mainPanel(
      tabsetPanel(
        type = "tabs",

        ### Table tab ----
        tabPanel(
          title = "Table",
          div(
            style = "height: 600px; overflow-y: auto;",
            tableOutput("table")
          )
        ),

        ### Plot tab ----
        tabPanel(
          title = "Plot",
          plotOutput("plot", height = 600)
        )
      )
    )
  )
)


# Server ----
server <- function(input, output, session) {
  # filter data ----
  filtered <- reactive({
    req(input$countries, cancelOutput = TRUE)

    xvar <- input$xvar
    yvar <- input$yvar
    range <- input$range

    # select country
    ess <- ess[ess$country %in% input$countries, ]

    # select variable
    ess[c("idno", "country", xvar, yvar)]
  })

  # render table ----
  output$table <- renderTable({
    filtered()
  }, height = 400)

  # render plot ----
  output$plot <- renderPlot({
    plot_data <- filtered() %>%
      drop_na() %>%
      mutate(across(where(is.numeric), .fns = as.ordered))

    xvar <- names(plot_data)[[3]]
    yvar <- names(plot_data)[[4]]

    ggplot(plot_data) +
      aes(x = .data[[xvar]], y = .data[[yvar]], group = .data[[xvar]]) +
      geom_violin(fill = "lightblue", show.legend = FALSE) +
      theme_classic()
  })
}

shinyApp(ui = ui, server = server)
6.3 One step further: Validation
req()is useful for simply controlling reactivity in generalvalidate()is useful for also providing a user with feedbackvalidate()is fed withneed()conditions which take two arguments:- An expression that is tested for truthiness
- A message that is shown to the user if the expression is not truthy
validate()is very bare-bones! For more sophisticated input validation, check outshinyFeedback- Input validation is but one of many techniques in defensive programming which is a good principle for making Shiny apps
filtered <- reactive({
  validate(
    need(input$countries, message = "At least one country must be specified.")
  )

  xvar <- input$xvar
  yvar <- input$yvar
  range <- input$range

  # select country
  ess <- ess[ess$country %in% input$countries, ]

  # select variable
  ess[c("idno", "country", xvar, yvar)]
}) %>%
  bindEvent(input$button, ignoreNULL = FALSE)
Complete code (important lines are highlighted)
library(dplyr)
library(tidyr)
library(shiny)
library(plotly)
library(leaflet)
library(haven)

ess <- readRDS("ess_trust.rds")
ess_geo <- readRDS("ess_trust_geo.rds")

# UI ----
ui <- fluidPage(
  titlePanel("European Social Survey - round 10"),

  ## Sidebar ----
  sidebarLayout(
    sidebarPanel(
      ### select dependent variable
      selectInput(
        "xvar",
        label = "Select a dependent variable",
        choices = c(
          "Trust in country's parliament" = "trust_parliament",
          "Trust in the legal system" = "trust_legal",
          "Trust in the police" = "trust_police",
          "Trust in politicians" = "trust_politicians",
          "Trust in political parties" = "trust_parties",
          "Trust in the European Parliament" = "trust_eu",
          "Trust in the United Nations" = "trust_un"
        )
      ),

      ### select a variable ----
      selectInput(
        "yvar",
        label = "Select an independent variable",
        choices = c(
          "Placement on the left-right scale" = "left_right",
          "Age" = "age",
          "Feeling about household's income" = "income_feeling",
          "How often do you use the internet?" = "internet_use",
          "How happy are you?" = "happiness"
        )
      ),

      ### select a country ----
      selectizeInput(
        "countries",
        label = "Filter by country",
        choices = unique(ess$country),
        selected = "FR",
        multiple = TRUE
      )
    ),

    ## Main panel ----
    mainPanel(
      tabsetPanel(
        type = "tabs",

        ### Table tab ----
        tabPanel(
          title = "Table",
          div(
            style = "height: 600px; overflow-y: auto;",
            tableOutput("table")
          )
        ),

        ### Plot tab ----
        tabPanel(
          title = "Plot",
          plotOutput("plot", height = 600)
        )
      )
    )
  )
)


# Server ----
server <- function(input, output, session) {
  # filter data ----
  filtered <- reactive({
    validate(
      need(input$countries, message = "At least one country must be specified.")
    )

    xvar <- input$xvar
    yvar <- input$yvar
    range <- input$range

    # select country
    ess <- ess[ess$country %in% input$countries, ]

    # select variable
    ess[c("idno", "country", xvar, yvar)]
  })

  # render table ----
  output$table <- renderTable({
    filtered()
  }, height = 400)

  # render plot ----
  output$plot <- renderPlot({
    plot_data <- filtered() %>%
      drop_na() %>%
      mutate(across(where(is.numeric), .fns = as.ordered))

    xvar <- names(plot_data)[[3]]
    yvar <- names(plot_data)[[4]]

    ggplot(plot_data) +
      aes(x = .data[[xvar]], y = .data[[yvar]], group = .data[[xvar]]) +
      geom_violin(fill = "lightblue", show.legend = FALSE) +
      theme_classic()
  })
}

shinyApp(ui = ui, server = server)
7 Other important concepts
- Shiny’s reactivity is easy to learn and hard to master
- We have started with basic concepts (inputs, outputs, reactive graphs)
- … and ended with more advanced concepts (observers, events, updaters, truthiness)
- Nonetheless, there is still much to be explored that reaches far beyond this workshop
- Here we provide a non-exhaustive list of concepts, functions, and extensions that might serve useful when dealing with Shiny’s reactivity
- A more exhaustive list was created by Shiny developer Nan Xiao: Awesome Shiny extensions
- Base Shiny:
- Dynamic UI
- Add, manipulate, and remove UI elements from the server function
insertUIandremoveUIshinyjspackage for advanced control- See also this blog article on dynamic UIs
- Isolation
- Sever reactive values from the reactive graph
isolate- See also this blog article
- Freezing
- Prevent an event from triggering until the next flush
freezeReactiveValue- We have introduced this briefly in the section about updaters
- Reactive values
- Values or list-likes that are able to take dependencies in reactive expressions
reactiveValandreactiveValues- Reactive values are essentially a bare-bones version of
reactive(), but for a short introduction, see chapter 15.1 of Mastering Shiny
- Flush events
- Execute code after / before the reactive graphs finishes / starts
onFlush- See also this blog article about execution scheduling
- Caching
- Temporarily store computationally intensive results to improve performance
bindCache
- Data storage
- Improve input/output of large data using local or remote databases (e.g. SQLite, Google Sheets, Dropbox, Amazon S3)
- See this blog article
- Scheduled invalidation
- Invalidate reactive expressions after some time has passed
invalidateLater
- Input validation
- A more sophisticated alternative to
reqallowing multiple tests and more flexible conditions. validate
- A more sophisticated alternative to
- Safe execution
- Notify the user when something gone wrong with useful error messages instead of plain R errors
base::tryCatchandbase::withCallingHandlersprovide mechanisms to implement safe errorsshinyWidgets::execute_safelyandshinyvalidateare implementations found in the wild- See also chapter 6: UX Matters of Colin Fay’s Engineering Production-Grade Shiny Apps
- Modularization
- Package large Shiny apps into isolated modules to increase maintainability
moduleServer- See also this blog article
- Testing server logics
- Set up a mocked Shiny server to use in unit tests
testServer- Particularly useful for making a robust Shiny package
- Advanced approaches also exist, e.g.
shinytest2orreactor
- Javascript
- Shiny apps can be built without ever seeing a single line of Javascript – but Javascript can still come in handy for that last mile of customization
- See chapter 17 of Engineering Production-Grade Shiny Apps and chapter 10 of Outstanding User Interfaces with Shiny for useful primers on Javascript in Shiny
- Dynamic UI
- Shiny extensions
- Event-based reactivity
gargoyle- Create and trigger custom events to control the reactivity flow
- Shiny event tracking
shinylogsorshiny.telemetry- Track inputs, outputs, errors and session events and optionally use them for logging
- Parallelization and asynchronous programming
shiny.worker- Delegate heavy computation tasks to seperate processes to keep Shiny app responsive
- URL routing
- Route to specific parts of a Shiny app by modifying the URL path
shiny.routerandscenesupdateQueryStringandgetQueryStringin base Shiny- Example:
https://shinyapp.com/plotto access a plot
- Reactivity logging
reactlog- Interactively supervise reactivity a posteriori
- Flame graphs
profvis- Interactively understand bottlenecks of a Shiny app
- Event-based reactivity
8 Exercises
8.1 Observers and reactives
Imagine you need to implement the following features in a Shiny app. In principle, would you rather use a reactive or an observer (or both) for these tasks?
- Filtering a dataset as input for both
lm()andggplot(). - Reading from a database.
- Writing to a database.
- Update an input selection with new selection values.
- Collect the results of a linear regression done in the Shiny app.
- Display a password prompt and check if the credentials are correct.
- Filtering a dataset for two different operations is a good use case for
reactive()as its output value can be cached. - Reading from a file or a database is generally a task for
reactive()as the data read in R must be stored. This cannot be done using observers. - Writing to a database, however, should be done in an observer because the return value does not matter for writing.
- Updating the UI is usually done in an observer due to their eager evaluation.
- Results of a calculation in Shiny are often used for further operations down the line (e.g. visualization). They are thus best handled by a reactive.
- Ideally, passwords should stay in the R session for as short as possible. Thus they should not be handled by a reactive because reactive values are cached until the next invalidation. Additionally, proper password checks are performed using external databases which calls for observers.
The following code contains two observers. Both observers depend on the same input (input$button), so their execution order can only be determined by their position in the code. Thus, "2nd observer" is printed before "1st observer". Study the documentation of ?observe and fix the app such "1st observer" is always printed first.
observe() features an argument called priority which allows you to control the execution order. A higher value indicates a higher priority. Setting priority = 1 makes the “1st observer” run before the “2nd observer” which has a default priority of 0.
Taking the Shiny app below, gradually enter letters to the text input. Observe the printed messages in your R console. Why is the code in reactive() never run but the code in observe() is? Fix the example such that the code in reactive() is executed as well.
Recall one of the main differences between observe() and reactive(): Reactives are lazy, observers are eager. Eagerly evaluated code triggers every time a dependency is invalidated, lazily evaluated triggers only when it is called from outside.
The code in observe() is run because the code takes a dependency on input$text. Whenever the text input is changed, the observer is re-run. The code in reactive() also takes a dependency on input$text, but since reactives are evaluated lazily, reactive() does not changes in the input. It only executes when it is called by a reactive consumer such as observe() or a render function. To make the code in reactive() run, we can let the observer call it:
Given the code below, which takes a variable and plots a histogram, print the summary of the selected variable each time a new variable is selected. How can this task be done without duplicating code?
ess <- readRDS("ess_trust.rds")

ui <- fluidPage(
  selectInput(
    "var",
    "Select a variable",
    names(ess)[startsWith(names(ess), "trust")]
  ),
  selectInput(
    "country",
    "Select a country",
    unique(ess$country)
  ),
  plotOutput("plot")
)

server <- function(input, output, session) {
  output$plot <- renderPlot({
    ess <- ess[ess$country %in% input$country, ]
    ggplot(ess) +
      aes(.data[[input$var]]) +
      geom_histogram()
  })
}

shinyApp(ui, server)To print the summary, implement an observer that prints the summary() of the selected variable. However, because the ess object is also filtered by the selected country, we would need to copy the filtering process to the observer as well, thus duplicating code. To avoid duplicating code, we can add a reactive() that performs the country filtering. The return value can then be forwarded to both observe() and renderPlot().
ui <- fluidPage(
  selectInput(
    "var",
    "Select a variable",
    names(ess)[startsWith(names(ess), "trust")]
  ),
  selectInput(
    "country",
    "Select a country",
    unique(ess$country)
  ),
  plotOutput("plot")
)

server <- function(input, output, session) {
  ess_country <- reactive({
    ess[ess$country %in% input$country, ]
  })

  observe({
    print(summary(ess_country()[[input$var]]))
  })

  output$plot <- renderPlot({
    ggplot(ess_country()) +
      aes(.data[[input$var]]) +
      geom_histogram()
  })
}

shinyApp(ui, server)
8.2 Updates and events
The code below implements a UI that contains checkboxes with four European regions (Central, Eastern, Southern, Northern) and an input selection for the country. Change the app such that selectizeInput() only shows those countries belonging to a region selected in checkboxGroupInput().
regions <- list(
  Central = c("AT", "BE", "CH", "DE", "NL", "PL", "CZ"),
  Eastern = c("BG", "EE", "HR", "HU", "LT", "LV", "PL", "SI", "SK"),
  Southern = c("ES", "IT", "PT", "RS", "ME"),
  Northern = c("IS", "SE", "FI", "GB", "IE", "DK")
)

ui <- fluidPage(
  checkboxGroupInput(
    "region",
    label = "Select a European region",
    choices = names(regions)
  ),
  selectizeInput(
    "country",
    label = "Select a country",
    choices = regions
  )
)

server <- function(input, output, session) {

}

shinyApp(ui, server)The function you need to update the input selection is called updateSelectizeInput().
In the solution, I add an observer with updateSelectizeInput() that updates selectizeInput(). The updated values correspond to the countries of the selected region in the regions list.
regions <- list(
  Central = c("AT", "BE", "CH", "DE", "NL", "PL", "CZ"),
  Eastern = c("BG", "EE", "HR", "HU", "LT", "LV", "PL", "SI", "SK"),
  Southern = c("ES", "IT", "PT", "RS", "ME"),
  Northern = c("IS", "SE", "FI", "GB", "IE", "DK")
)

ui <- fluidPage(
  checkboxGroupInput(
    "region",
    label = "Select a European region",
    choices = names(regions)
  ),
  selectizeInput(
    "country",
    label = "Select a country",
    choices = regions
  )
)

server <- function(input, output, session) {
  observe({
    updateSelectizeInput(
      inputId = "country",
      choices = regions[input$region]
    )
  })
}

shinyApp(ui, server)Looking at the app from exercise 2.1, selectizeInput() is updated every time a European region is selected. In this case, this is probably what we expect from the app. To get a little more control of the reactivity flow, implement an action button that needs to be pressed in order for selectizeInput() to be updated.
Code from exercise 2.1
regions <- list(
  Central = c("AT", "BE", "CH", "DE", "NL", "PL", "CZ"),
  Eastern = c("BG", "EE", "HR", "HU", "LT", "LV", "PL", "SI", "SK"),
  Southern = c("ES", "IT", "PT", "RS", "ME"),
  Northern = c("IS", "SE", "FI", "GB", "IE", "DK")
)

ui <- fluidPage(
  checkboxGroupInput(
    "region",
    label = "Select a European region",
    choices = names(regions)
  ),
  selectizeInput(
    "country",
    label = "Select a country",
    choices = regions
  )
)

server <- function(input, output, session) {
  observe({
    updateSelectizeInput(
      inputId = "country",
      choices = regions[input$region]
    )
  })
}

shinyApp(ui, server)In the solution, I add an observer with updateSelectizeInput() that updates selectizeInput(). The updated values correspond to the countries of the selected region in the regions list.
regions <- list(
  Central = c("AT", "BE", "CH", "DE", "NL", "PL", "CZ"),
  Eastern = c("BG", "EE", "HR", "HU", "LT", "LV", "PL", "SI", "SK"),
  Southern = c("ES", "IT", "PT", "RS", "ME"),
  Northern = c("IS", "SE", "FI", "GB", "IE", "DK")
)

ui <- fluidPage(
  checkboxGroupInput(
    "region",
    label = "Select a European region",
    choices = names(regions)
  ),
  selectizeInput(
    "country",
    label = "Select a country",
    choices = regions
  ),
  actionButton(
    "button",
    label = "Update",
    icon = icon("refresh")
  )
)

server <- function(input, output, session) {
  observe({
    updateSelectizeInput(
      inputId = "country",
      choices = regions[input$region]
    )
  }) %>%
    bindEvent(input$button)
}

shinyApp(ui, server)The (admittedly quite useless) Shiny app below implements two buttons, each of which adds 1 to either tab A or tab B. Right now, to see the result in either tab, you would need to manually click on the tabs. Change the app such that changing button A or B automatically opens the corresponding tab.
ui <- fluidPage(
  sidebarLayout(
    id = "tabset_panel",
    sidebarPanel(
      actionButton("button_a", "Add to A"),
      br(),
      actionButton("button_b", "Add to B")
    ),
    mainPanel(
      tabsetPanel(
        tabPanel(
          title = "Tab A",
          verbatimTextOutput("tab_a")
        ),
        tabPanel(
          title = "Tab B",
          verbatimTextOutput("tab_b")
        )
      )
    )
  )
)

server <- function(input, output, session) {
  output$tab_a <- renderPrint(as.vector(input$button_a))
  output$tab_b <- renderPrint(as.vector(input$button_b))
}

shinyApp(ui, server)The function that you need to update a tabset panel is called updateTabsetPanel(). It requires the ID assigned to tabsetPanel().
While there are technically many ways to solve this task, the most obvious one at this point requires two observers. If you want to implement the solution using only a single observer, consider using super assignment (see ?"<<-" or here).
In the server function, I add two observers. The first only triggers when tab_a is pressed, the second one when tab_b is pressed. Within each observer, the tabset panel is updated using updateTabsetPanel(). inputId takes "tabset_panel", the ID assigned to tabsetPanel() in the UI. selected takes the label of the tab that should be selected.
It is also possible to implement a solution with only a single observer, but this is much trickier. The code chunk below implements such a solution using the super assignment operator <<-. Since reactive expressions are technically functions, you can use <<- to conveniently store non-reactive values in the session.
ui <- fluidPage(
  sidebarLayout(
    sidebarPanel(
      actionButton("button_a", "Add to A"),
      br(),
      actionButton("button_b", "Add to B")
    ),
    mainPanel(
      tabsetPanel(
        id = "tabset_panel",
        tabPanel(
          title = "Tab A",
          verbatimTextOutput("tab_a")
        ),
        tabPanel(
          title = "Tab B",
          verbatimTextOutput("tab_b")
        )
      )
    )
  )
)

server <- function(input, output, session) {
  output$tab_a <- renderPrint(as.vector(input$button_a))
  output$tab_b <- renderPrint(as.vector(input$button_b))

  observe({
    updateTabsetPanel(inputId = "tabset_panel", selected = "Tab A")
  }) %>%
    bindEvent(input$button_a)

  observe({
    updateTabsetPanel(inputId = "tabset_panel", selected = "Tab B")
  }) %>%
    bindEvent(input$button_b)
}

shinyApp(ui, server)
Alternative solution
ui <- fluidPage(
  sidebarLayout(
    sidebarPanel(
      actionButton("button_a", "Add to A"),
      br(),
      actionButton("button_b", "Add to B")
    ),
    mainPanel(
      tabsetPanel(
        id = "tabset_panel",
        tabPanel(
          title = "Tab A",
          verbatimTextOutput("tab_a")
        ),
        tabPanel(
          title = "Tab B",
          verbatimTextOutput("tab_b")
        )
      )
    )
  )
)

server <- function(input, output, session) {
  output$tab_a <- renderPrint(as.vector(input$button_a))
  output$tab_b <- renderPrint(as.vector(input$button_b))

  last_a <- 0
  last_b <- 0
  observe({
    button_a <- input$button_a
    button_b <- input$button_b
    if (button_a != last_a) {
      last_a <<- button_a
      sel <- "Tab A"
    } else if (button_b != last_b) {
      last_b <<- button_b
      sel <- "Tab B"
    } else {
      return()
    }

    updateTabsetPanel(inputId = "tabset_panel", selected = sel)
  })
}

shinyApp(ui, server)
8.3 Truthiness and validation
The Shiny app below implements three features:
- A numeric input that lets you select a number to compute the natural logarithm of
- A file input that lets you read and print an R object from a file
- An input selection that shows you an emoji depending on the selected value
At its current state, the app does not go out of its way to check the input for correctness. What problems could this cause in the usage of the app? How can these problems be prevented? Implement an input validation that catches potential problems before they occur and gives appropriate feedback to the user.
ui <- fluidPage(
  fluidRow(
    column(
      4,
      numericInput(
        "number",
        label = "Select a number to compute the natural log of",
        value = 3
      )
    ),
    column(
      4,
      verbatimTextOutput("number_result")
    )
  ),

  fluidRow(
    column(
      4,
      fileInput(
        "file",
        label = "Select an RDS file"
      )
    ),
    column(
      4,
      verbatimTextOutput("file_result")
    )
  ),

  fluidRow(
    column(
      4,
      selectInput(
        "animal",
        label = "Select an animal",
        choices = c("dog", "cat", "mouse"),
        selected = "mouse",
        multiple = TRUE
      )
    ),
    column(
      4,
      htmlOutput("animal_result")
    )
  )
)

server <- function(input, output, session) {
  output$number_result <- renderPrint({
    log(input$number)
  })

  output$file_result <- renderPrint({
    readRDS(input$file)
  })

  output$animal_result <- renderUI({
    url <- switch(
      input$animal,
      dog = "https://images.emojiterra.com/google/noto-emoji/unicode-15.1/color/svg/1f415.svg",
      cat = "https://images.emojiterra.com/google/noto-emoji/unicode-15.1/color/svg/1f408.svg",
      mouse = "https://images.emojiterra.com/google/noto-emoji/unicode-15.1/color/svg/1f401.svg"
    )
    img(src = url, width = "30%")
  })
}

shinyApp(ui, server)Experiment with the app to find out ways the app could fail or produce an undesirable result. An undesirable result can be an error, but it can also be an unexpected value like NA.
The validate() function can take an arbitrary amount of need()s to check for multiple conditions.
If one condition needs to be checked before the other conditions, you can wrap it in a separate call to validate():
One problem with the app can be observed directly upon starting the app: The default value of input$file (which is NULL) cannot be read by readRDS(): Shiny issues an error. Similar behavior can be seen when selecting a non-natural number of when selecting multiple animals.
A possible solution to this problem is to use validate() to check the input before processing it. The following code chunk implements several checks:
- For
numericInput(), it checks whether the selected number is larger than 0. - For
fileInput(), it first checks whether the file isNULL. If not, it proceeds to check if the file exists and if it ends on.rds. - For
selectInput(), it checks whether at least one, but not two or more animals are selected.
Alternative solution
ui <- fluidPage(
  fluidRow(
    column(
      4,
      numericInput(
        "number",
        label = "Select a number to compute the natural log of",
        value = 3
      )
    ),
    column(
      4,
      verbatimTextOutput("number_result")
    )
  ),

  fluidRow(
    column(
      4,
      fileInput(
        "file",
        label = "Select an RDS file"
      )
    ),
    column(
      4,
      verbatimTextOutput("file_result")
    )
  ),

  fluidRow(
    column(
      4,
      selectInput(
        "animal",
        label = "Select an animal",
        choices = c("dog", "cat", "mouse"),
        selected = "mouse",
        multiple = TRUE
      )
    ),
    column(
      4,
      htmlOutput("animal_result")
    )
  )
)

server <- function(input, output, session) {
  output$number_result <- renderPrint({
    number <- input$number
    validate(
      need(number > 0, "Input must be a natural number.")
    )

    log(number)
  })

  output$file_result <- renderPrint({
    file <- input$file$datapath
    validate(need(!is.null(file), "Please select an RDS file"))
    validate(
      need(file.exists(file), "Input file must exist"),
      need(grepl("\\.rds$", file), "Input file must be .rds")
    )

    readRDS(file)
  })

  output$animal_result <- renderUI({
    animal <- input$animal
    validate(
      need(length(animal) > 0, "Please select an animal."),
      need(length(animal) < 2, "Please select a maximum of one animal.")
    )

    url <- switch(
      animal,
      dog = "https://images.emojiterra.com/google/noto-emoji/unicode-15.1/color/svg/1f415.svg",
      cat = "https://images.emojiterra.com/google/noto-emoji/unicode-15.1/color/svg/1f408.svg",
      mouse = "https://images.emojiterra.com/google/noto-emoji/unicode-15.1/color/svg/1f401.svg"
    )
    img(src = url, width = "30%")
  })
}

shinyApp(ui, server)