| \(\text{Unit i} \quad\) | \(Name \quad\) | \(X1_{i}^{Age} \quad\) | \(X2_{i}^{Educ.} \quad\) | \(D_{i}^{Unempl.} \quad\) | \(Y_{i}^{Lifesat.} \quad\) |
|---|---|---|---|---|---|
| 1 | Sofia | 29 | 1 | 1 | 3 |
| 2 | Sara | 30 | 2 | 1 | 2 |
| 3 | José | 28 | 0 | 0 | 5 |
| 4 | Yiwei | 27 | 2 | 1 | ? |
| 5 | Julia | 25 | 0 | 0 | 6 |
| 6 | Hans | 23 | 0 | 1 | ? |
| .. | .. | .. | .. | .. | .. |
| 1000 | Hugo | 23 | 1 | 0 | 8 |
Introduction
Chapter last updated: 11 Februar 2025
Questions/Learning outcomes: We learn about..
- ..definitions of AI/ML
- ..the AI landscape
- ..fundamental debates in AI
- ..applications of ML in the social sciences
- ..data & dimensionality
- ..ML terminology & basic concept (e.g., supervised vs. unsupervised)
- ..different types of research questions
The material for the following sessions is based on James et al. (2013), Molina and Garip (2019), James et al. (2013), Chollet and Allaire (2018) and others’ work (including some of my own).
1 Artificial intelligence & machine learning
1.1 What is AI?

- Artificial intelligence (AI): “[broadly] is intelligence exhibited by machines, particularly computer systems.” (Wikipedia, 10.2.2025)1
- Machine learning (ML): “a field of study in artificial intelligence concerned with the development and study of statistical algorithms that can learn from data and generalize to unseen data, and thus perform tasks without explicit instructions.” (Wikipedia, 10.2.2025)2
- Deep learning: “a subset of machine learning that focuses on utilizing neural networks to perform tasks such as classification, regression, and representation learning.” (Wikipedia, 10.2.2025)
- Data mining3
1.2 AI landscape & actors
- Different actors with varying interests: What are the goals/interests of the different actors below?4
- Researchers, e.g., LeCun, Hinton, Bengio (Turing Award: Nobel Prize in Computer Science; Physics Nobel Prize)
- Universities, e.g., LMU AI-HUB
- Companies: Google (DeepMind), Facebook, Microsoft (OpenAI), Baidu, etc.
- Countries: USA, China, etc. & current discussion about DeepSeek) (see e.g., Zand, Scheuermann, and Spiegel 2018)
- Individuals & citizens
Insights
- Various actors with varying interests that can often be subsumed under the concept of “competition”. In their daily lives individuals would simply like AI to just work (but are often not aware that AI is working in the background).
1.3 AI history
- History (Domingos 2015; Buchanan 2005; Roser 2022): Skepticism warranted.. who writes the history?
- Chollet and Allaire (2018, 2f)
- 1950s (“can we make computers ‘think’”)
- Symbolic AI: Dominant paradigm from 1950s to 1980s (peak popularity)
- Idea: handcraft sufficiently large set of explicit rules for manipulating knowledge
- Works for well-defined, logical problems such as chess but not for complex, fuzzy problems (image classification, speech recognition)
- Machine learning: Took off in the 1990s
- Idea: handcraft sufficiently large set of explicit rules for manipulating knowledge
Insights
- There are various books that summarize the history of AI. Importantly, theses surveys may be biased towards certain people/contexts.
1.4 AI stats: Investments, ability, costs, affiliation
- See Our World in Data for various graphs
- Ability: Chess ability of the best computers
- Computation used to train notable artificial intelligence systems (FLOPS)
- Affiliation of research teams
- Affiliation of researchers behind notable AI systems
- Number of datapoints used to train notable artificial intelligence systems
- Share of women among new artificial intelligence and computer science PhDs in the US and Canada
Insights
- Massive investments in the last years
- Ability: Best chess players are now beaten by ML algorithms.. a few years ago already actually (same for GO!)
- Costs: Costs go down over time but… (Imagenet)
- …computation underlying training of recently successful models is extremely high -> super computers (for notable DL systems!)
- Research as moved into industry away from universities
- Size of datasets necessary to train has grown for notable DL systems!
- Share of women in AI/Computer science is low.. (possible bias!)
- See, e.g., Our World in Data, Statista and OECD.ai for more statistics
- AI timelines: What do experts in artificial intelligence expect for the future?
1.5 AI stats: Language and image recognition capabilities
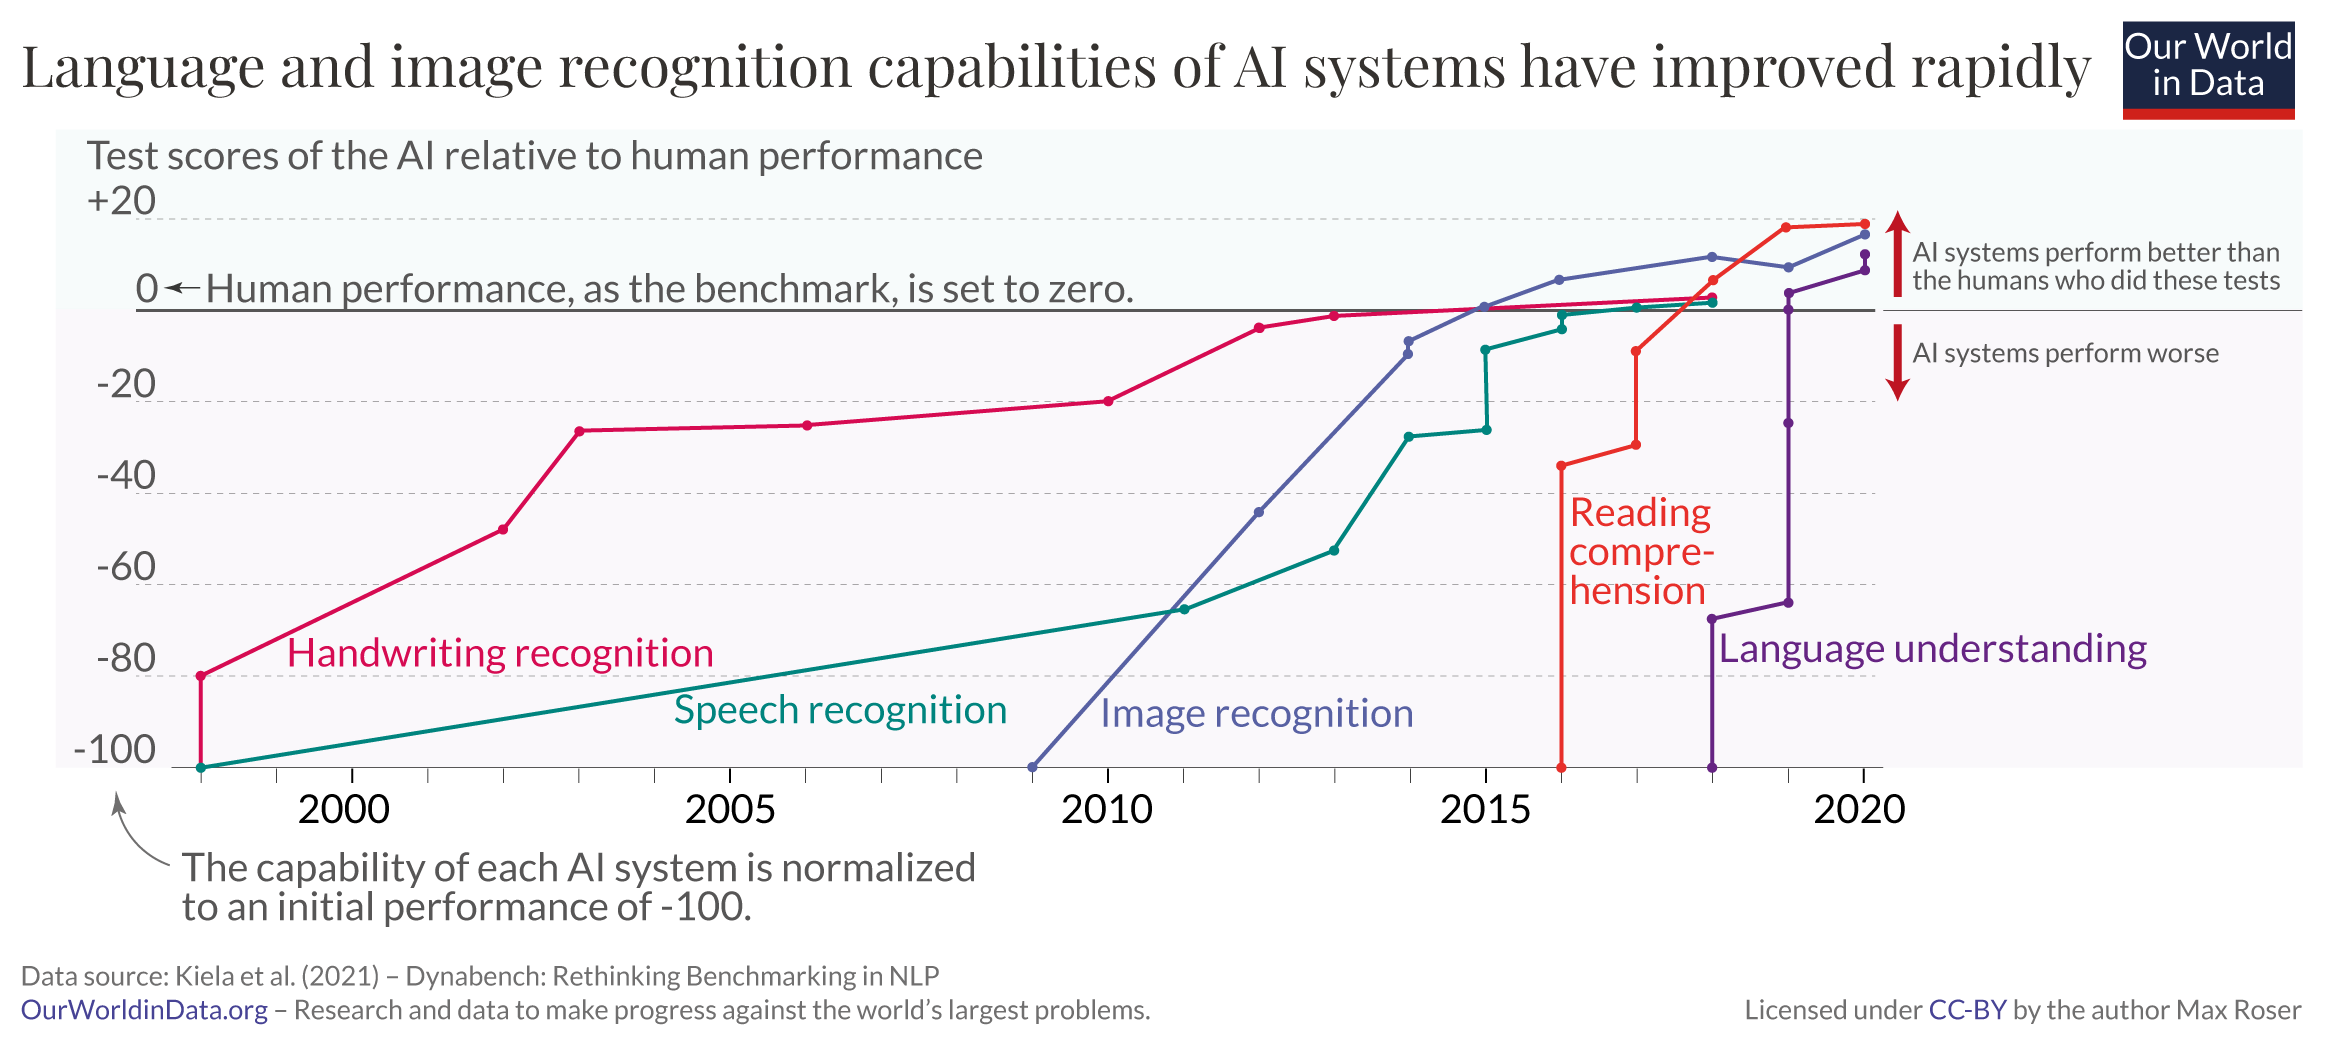
1.6 AI/ML Debates (1)
- There are various large, interconnected debates
- How accurate are the predictions of AI/machine learning models (Accuracy)?
- “Rebooting AI” (Marcus and Davis 2019)
- How should AI models be tested? (e.g., Competitions, Benchmarks, etc.)
- Are AI/machine learning models biased/unfair?
- Bias in AI models (training data, personnel, minorities) (e.g., Metz 2022, Ch. 15)
- “I call it a sea of dudes”5
- Garbage in, garbage out; Reproduction of inequalities (rental market/credit market)
- Interpretable machine learning (e.g., Molnar 2022; Rudin 2019)6
1.7 AI/ML Debates (2)
- How (by whom) is AI/machine learning weaponized? (e.g., Metz 2022, Ch. 16)
- Summary: “Weapons of Math Destruction” by Cathy O’Neill
- General adversarial networks (GANS)7 + adversarial attacks (e.g., Metz 2022, Ch. 13, 212)
- When will we reach the age of singularity/superintelligence?
2 Machine learning tasks in the social sciences
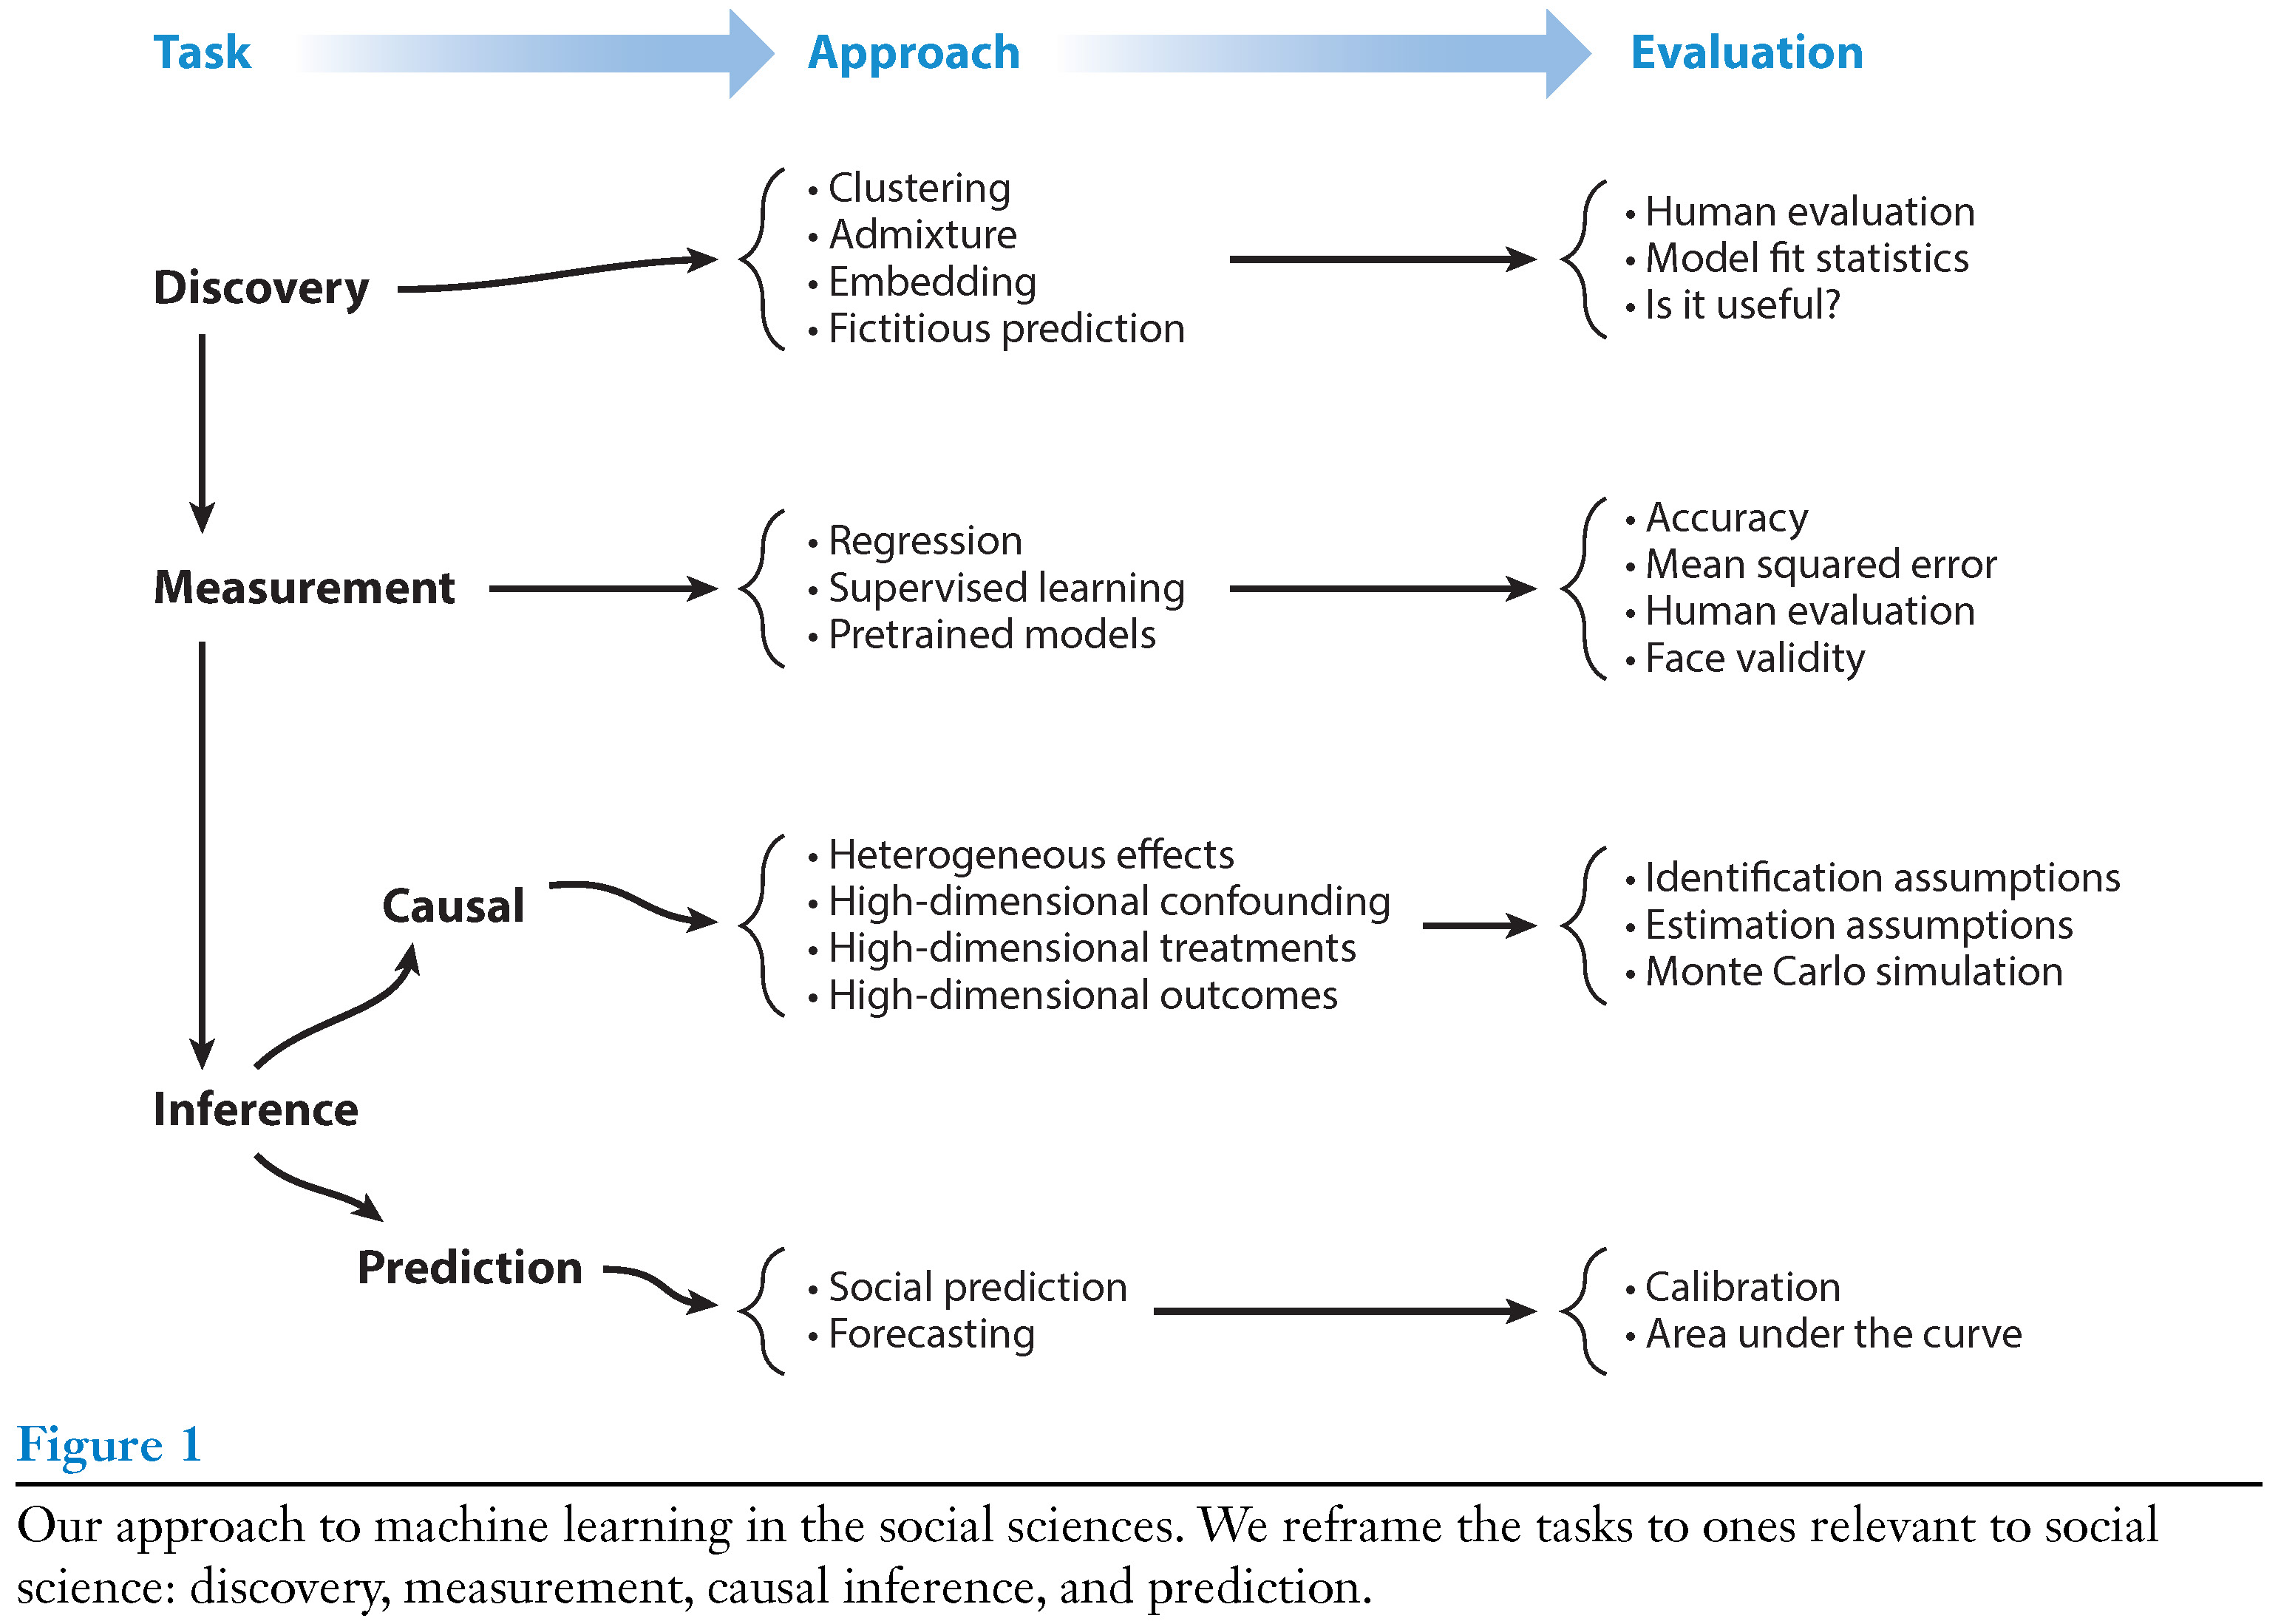
- Within social sciences ML is used for various tasks as summarized by Grimmer, Roberts, and Stewart (2021)8
- We’ll focus on prediction! (beware of ambiguity of “prediction”)
3 Terminology
3.1 Terminological differences (1)
- Terminology is a source of confusion (Athey and Imbens 2019, 689)
- Q: Do you know any machine learning terminology?
- Statistical learning vs. machine learning (ML) (James et al. 2013, 1)
- Terms reflect disciplinary origin (statistics vs. computer science)
- We will use the two as synonyms (as well as AI)
- Regression problem: Prediction of a continuous or quantitative output values (James et al. 2013, 2)
- e.g., predict wage or life satisfaction
- Classification problem: Prediction of a non-numerical value—that is, a categorical or qualitative output
- e.g., predict increase/decrease of stock market [0,1] or unemployment [0,1]
- Q: What does the “inference” in statistical inference stand for? (Population vs. sample)
3.2 Terminological differences (2)
- Terminology: Well-established older labels vs. “new” terminology
- Sample used to estimate the parameters vs. training sample
- Model is estimated vs. Model is trained/fitted
- Regressors, covariates, predictors vs. features (or inputs)
- Dependent variable/outcome vs. output
- Regression parameters (coefficients) vs. weights
4 Supervised vs. unsupervised learning
- Good analogy: Child in Kindergarden classifies toys (with or without teacher’s supervision)
5 Data & dimensionality
Questions/Learning outcomes:
- Understand how variables/data relate to dimensionality as well as univariate/joint distributions.
- Grasp the curse of dimensionality.
5.1 Data: (Empirical) Univariate distributions
- Q: Where are most individuals located on the life_satisfaction and unemployed scales?
- Q: Why is data sparsity generally a problem? Inference?
| 0 | 1 | 2 | 3 | 4 | 5 | 6 | 7 | 8 | 9 | 10 |
|---|---|---|---|---|---|---|---|---|---|---|
| 34 | 14 | 42 | 49 | 76 | 170 | 169 | 323 | 462 | 212 | 213 |
| 0 | 1 |
|---|---|
| 1737 | 27 |
| 0 | 1 | 2 | 3 | 4 | 5 | 6 |
|---|---|---|---|---|---|---|
| 172 | 156 | 411 | 354 | 242 | 132 | 297 |
5.2 Data: (Empirical) Joint distributions (2 dimensions)
| 0 | 1 | 2 | 3 | 4 | 5 | 6 | 7 | 8 | 9 | 10 | |
|---|---|---|---|---|---|---|---|---|---|---|---|
| not unemployed | 31 | 14 | 41 | 50 | 75 | 163 | 166 | 322 | 461 | 213 | 209 |
| unemployed | 3 | 0 | 2 | 0 | 1 | 7 | 4 | 2 | 4 | 0 | 4 |
5.3 Data: (Empirical) Joint distributions (3 dimensions)
- Measurement process: Assign individuals to cells → distribute across cells → distribution
- 1 variable → univariate distribution
- 2+ variables → multivariate joint distribution
Q: Above units are grouped on three variables (= dimensions): Life Satisfaction (Y) [0-10], Unemployed (D) [0,1] and Education (X) [0-6]
- How many cells? How many dimensions? (How about time?) Jitter?
- What would the corresponding dataset/dataframe look like?
- What would a joint distribution with 4 variables look like? Can we visualize it?
- What is a conditional distribution?
- What would the joint distribution look like if the variables were perfectly correlated?
- What is the curse of dimensionality? (imagine many variables!)
Insights
- Number of cells/dimensions: \(11*2*7 = 154\) cells; \(3\) dimensions (= variables)
- Corresponding dataset/dataframe: 3 columns * n rows
- Joint distribution with 4 variables
- Hard to imagine.. but if the 4th dimension is categorical then one could generate several 3-dimensional plots
- Conditional distribution: e.g., joint distribution of life satisfaction and unemployed conditional on education = 2 (a slice)
- Perfect correlation: All data points on one line/plane
- Curse of dimensionality: refers to various challenges and limitations that arise when working with high-dimensional data in machine learning
- As number of features/dimensions in dataset increases it is increasingly difficult to analyze and model the data effectively
- Sparsity of Data: In high-dimensional spaces, data points tend to become increasingly sparse. As the number of dimensions grows, the volume of the space increases exponentially, and the available data becomes more thinly spread out. This sparsity can lead to difficulties in estimating densities, making it harder to identify meaningful patterns within the data.
- ..also increased computational complexity, higher danger of overfitting and increased data requirements (ideally enough data to cover space)
5.4 Data: One more joint distribution (3 dimensions)
Insights
- Always consider how much data you have in certain regions of your outcome variable and features/predictors.
- Big difference between theoretically possible variable values (and value combinations) vs. what we empirically observe.
5.5 Data: Exercise
- What is the difference between a univariate distribution and a joint distribution? Give examples for both.
- We discussed that any variable has a set of theoretically possible values which it can take on. Empirical observations may then be assigned to those values or not. The same is true for value combinations of two or more variables. This all sounds quite abstract.
- Thinking of two variables education (0-4) and life satisfaction (0-10).
- What theoretical values does education have? And life satisfaction?
- When we combine the theoretical values of the two variables above, how many combinations are there?
- Imagine you collect empirical data: In which joint values/cells of the two variables might we have the fewest observations?
- Thinking of two variables education (0-4) and life satisfaction (0-10).
- What is the curse of dimensionality?
6 Research questions
Questions/Learning outcomes:
- Understand difference between normative vs. empirical analytical research questions
- Understand different between different empirical analytical research questions (descriptive/causal/predictive)
6.1 Types of RQs
- Normative vs. empirical analytical (positive)
- Should men and women be paid equally? Are men and women paid equally (and why?)?
- Empirical analytical RQs: What? vs. Why? (Gerring 2012, 722-723)
- What? Describe aspect of the world
- Why? concern causal arguments that hold that one or more phenomena generate change in some outcome (imply a counterfactual)
- My personal preference: descriptive vs. causal vs. predictive questions
6.2 Descriptive research questions
Measure:‘All things considered, how satisfied are you with your life as a whole nowadays? Please answer using this card, where 0 means extremely dissatisfied and 10 means extremely satisfied.’
Descriptive questions (univariate)
- What is Laura’s level of life satisfaction?
- What is the distribution of life satisfaction (Y)?
| 0 | 1 | 2 | 3 | 4 | 5 | 6 | 7 | 8 | 9 | 10 |
|---|---|---|---|---|---|---|---|---|---|---|
| 34 | 14 | 43 | 50 | 76 | 170 | 170 | 324 | 465 | 213 | 213 |
- We can add as many variables/dimensions as we like → multivariate (e.g. gender, time)
- Q: What would the table above look like when we add gender as a second dimension?
- Descriptive questions (multivariate)
- Do females have higher life satisfaction than males?
- Did life satisfaction rise across time?
6.3 Causal research questions (Why?)
| 0 | 1 | 2 | 3 | 4 | 5 | 6 | 7 | 8 | 9 | 10 | |
|---|---|---|---|---|---|---|---|---|---|---|---|
| not unemployed | 31 | 14 | 41 | 50 | 75 | 163 | 166 | 322 | 461 | 213 | 209 |
| unemployed | 3 | 0 | 2 | 0 | 1 | 7 | 4 | 2 | 4 | 0 | 4 |
- Mean employed: 7.05; Mean unemployed: 5.67
- Descriptive questions: Do unemployed have a different/lower level of life satisfaction from/than non-victims?
- Causal questions: Is there a causal effect of unemployment on life satisfaction?
- Insights
- Data underlying descriptive & causal questions is the same
- Causal questions aways concern one (or more) explanatory causal factors
6.4 Predictive research questions
- Examples
- Can we predict recidivism (reoffending) of prisoners?
- Can we predict life satisfaction using unemployment?
- How well can we predict recidivism/life satisfaction? (accuracy)
- What are the most important features (predictors) to predict life satisfaction/reoffending?
- Abstract
- Can we predict outcomes/outputs (given our features/predictors/inputs)?
- Is the available data sufficiently informative to learn the relationships between inputs and outputs?
- Predictions can be made for individuals or groups/aggregates (averages)
- e.g., Predict Paul’s trust or (average) trust across countries
- Predictions often made for unseen (sometimes future) observations
- Quick summery…and more on that later!
Insights
- Descriptive, causal and predictive questions differ but are all answered based on data, i.e., join distribution (albeit to train predictive models we split the data)
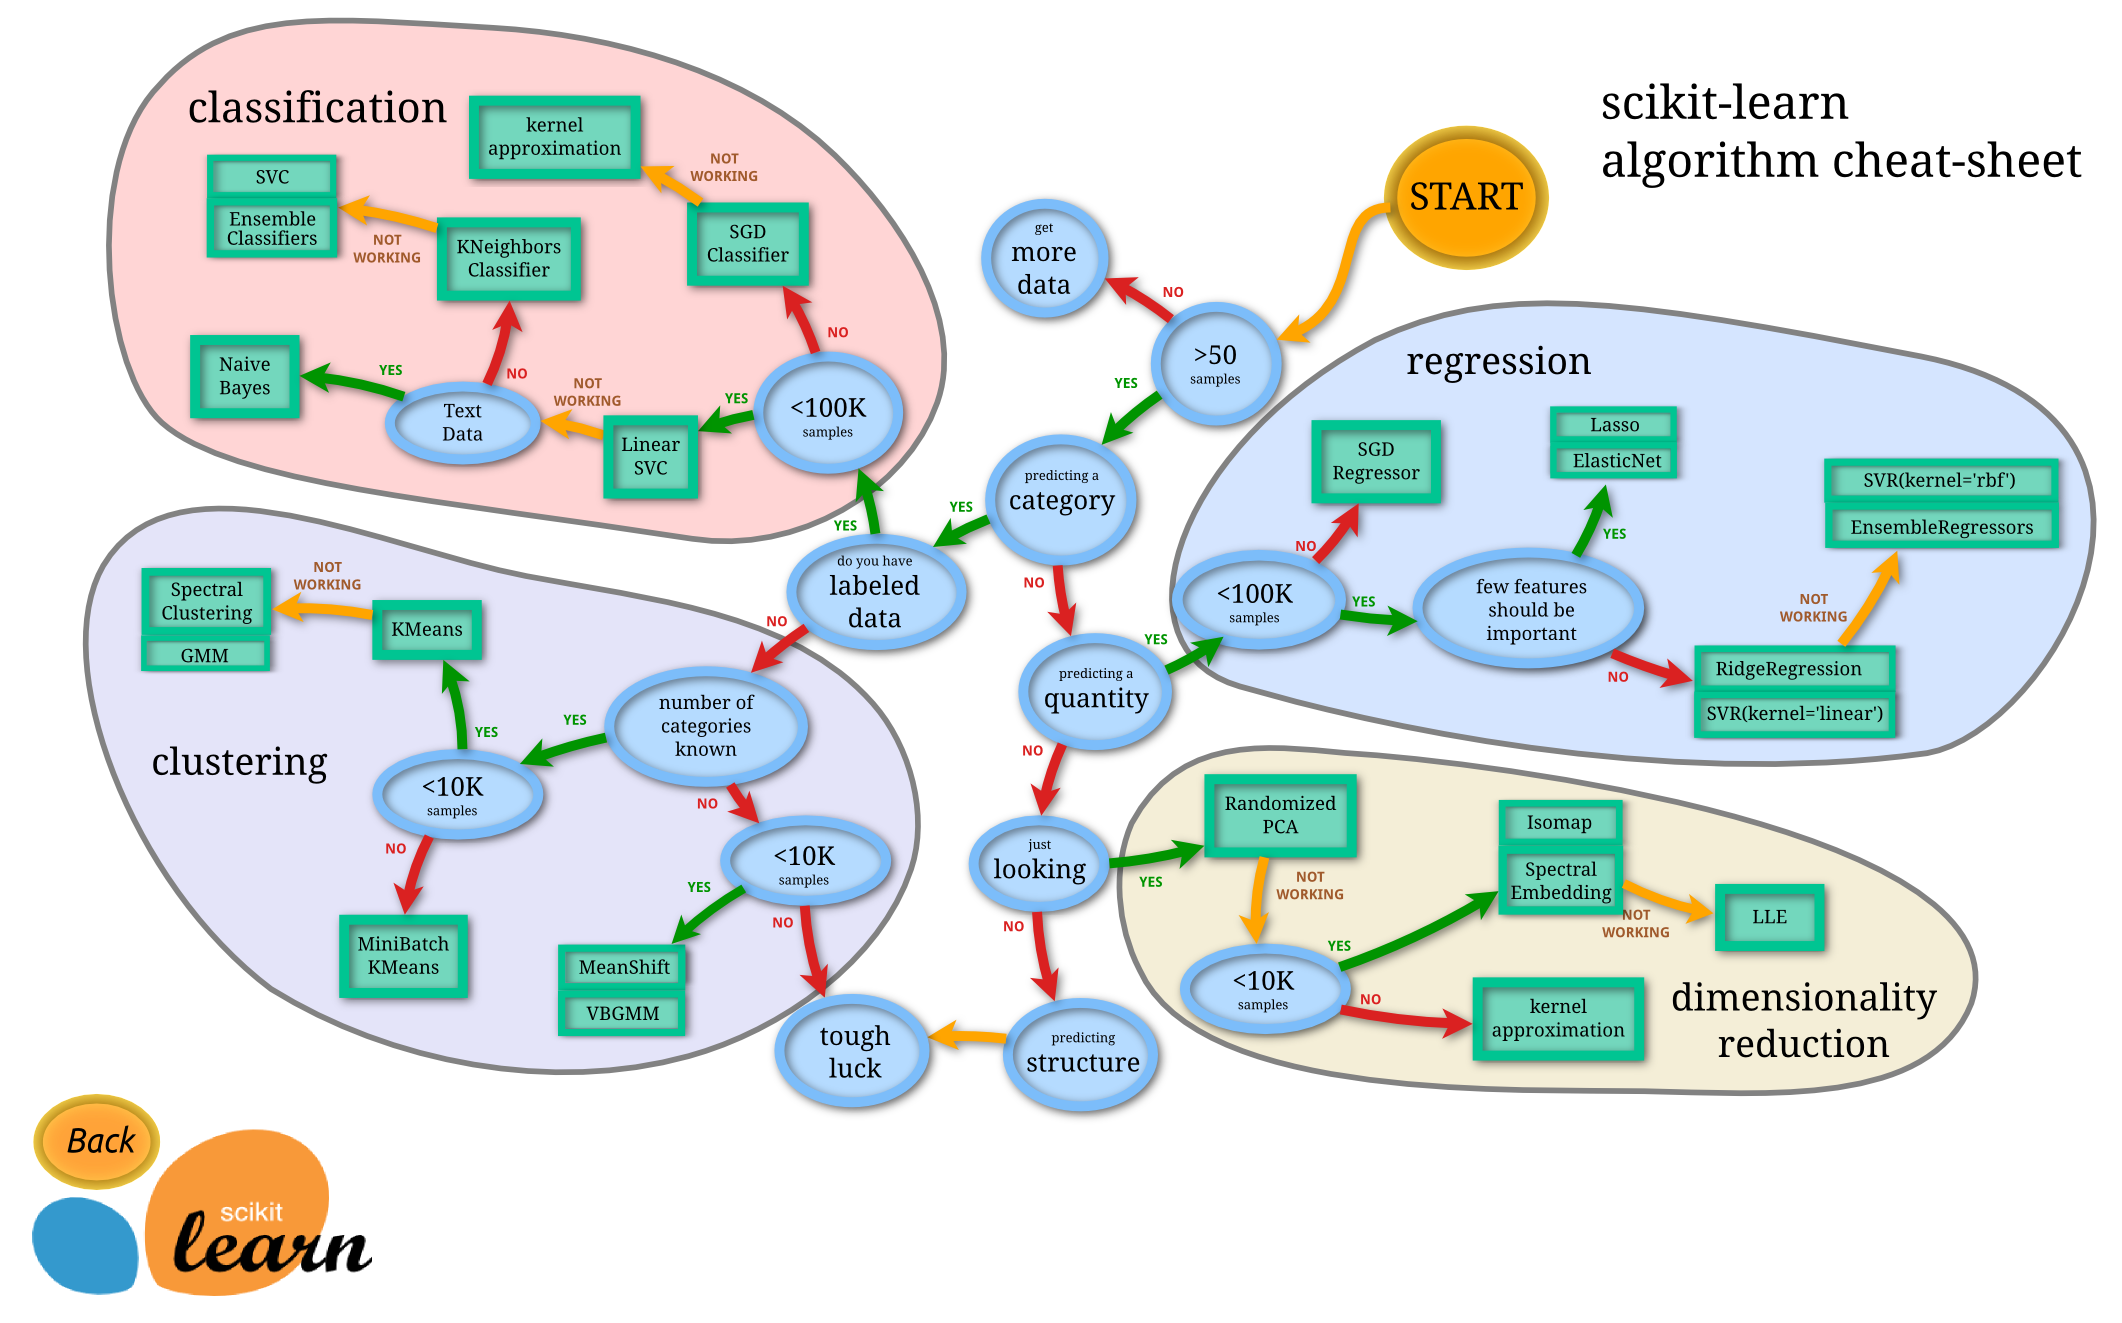
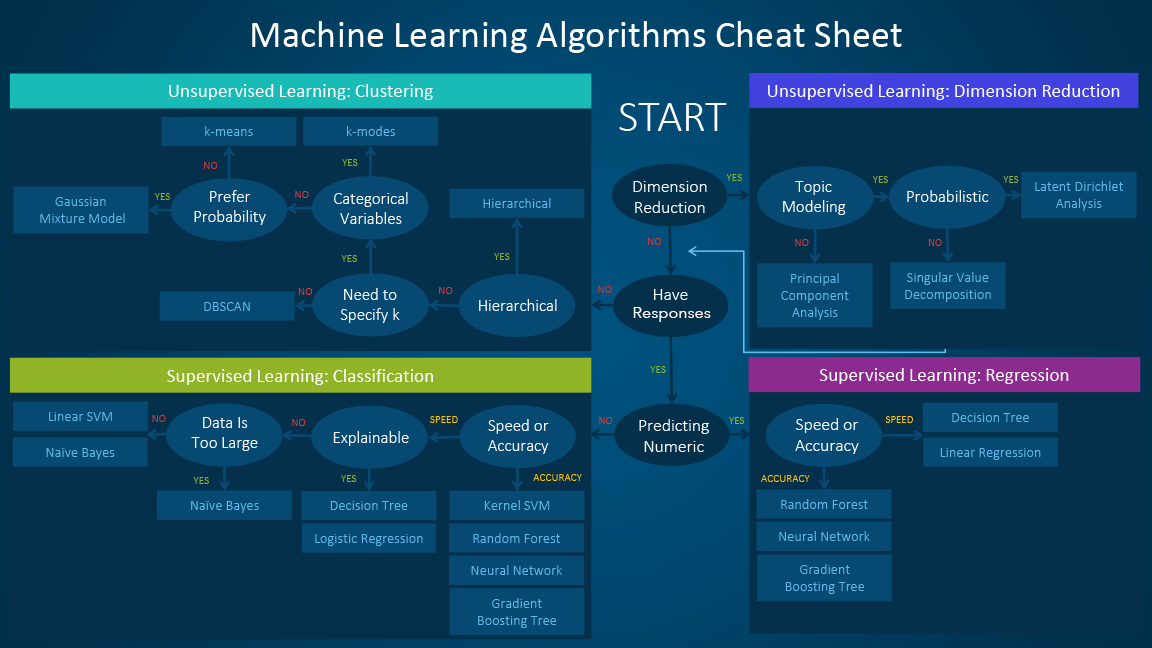
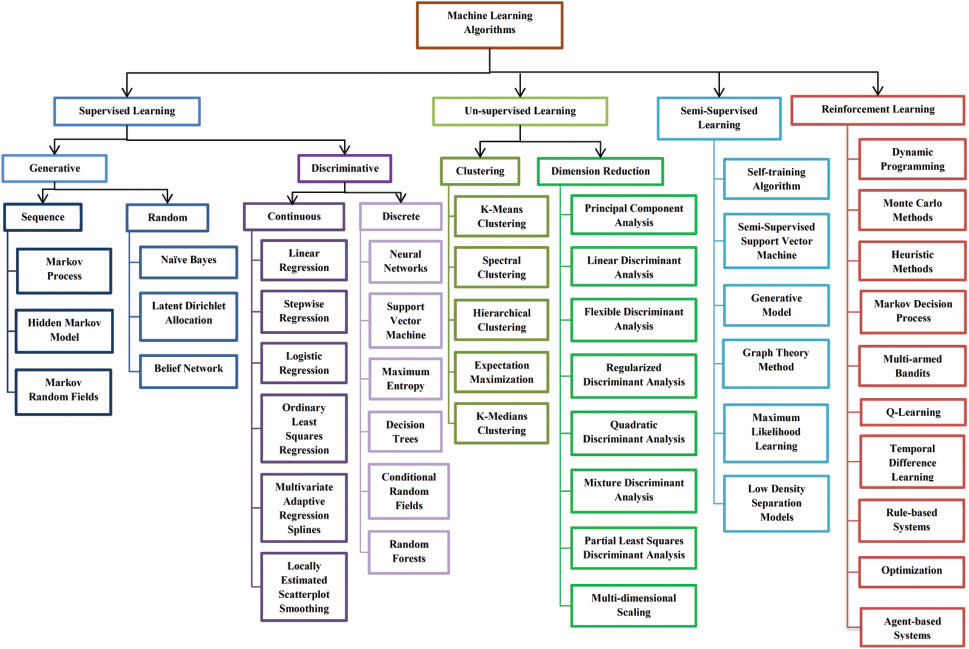
6.5 Machine learning decision trees
- Different more or less helpful ML decision trees: Figure 1 seems most helpful (see also Figure 2 and Figure 3).
References
Alpaydin, Ethem. 2014. Introduction to Machine Learning. MIT Press.
Athey, Susan, and Guido W Imbens. 2019. “Machine Learning Methods That Economists Should Know About.” Annual Review of Economics 11 (1): 685–725.
Barberá, Pablo, Amber E Boydstun, Suzanna Linn, Ryan McMahon, and Jonathan Nagler. 2021. “Automated Text Classification of News Articles: A Practical Guide.” Political Analysis: An Annual Publication of the Methodology Section of the American Political Science Association 29 (1): 19–42.
Bauer, Paul C, Pablo Barberá, Kathrin Ackermann, and Aaron Venetz. 2017. “Is the Left-Right Scale a Valid Measure of Ideology?” Political Behavior 39 (3): 553–83.
Blumenstock, Joshua, Gabriel Cadamuro, and Robert On. 2015. “Predicting Poverty and Wealth from Mobile Phone Metadata.” Science 350 (6264): 1073–76.
Buchanan, Bruce G. 2005. “A (Very) Brief History of Artificial Intelligence.” AI Magazine 26 (4): 53–53.
Cederman, Lars-Erik, and Nils B Weidmann. 2017. “Predicting Armed Conflict: Time to Adjust Our Expectations?” Science 355 (6324): 474–76.
Chancellor, Stevie, and Munmun De Choudhury. 2020. “Methods in Predictive Techniques for Mental Health Status on Social Media: A Critical Review.” NPJ Digital Medicine 3: 43.
Chollet, Francois, and J J Allaire. 2018. Deep Learning with R. Manning Publications.
Clemm von Hohenberg, Bernhard, and Paul C Bauer. 2021. “Horseshoe Patterns: Visualizing Partisan Media Trust in Germany.” Socius 7: 23780231211028786.
Dahal, Biraj, Sathish A P Kumar, and Zhenlong Li. 2019. “Topic Modeling and Sentiment Analysis of Global Climate Change Tweets.” Social Network Analysis and Mining 9 (1): 24.
DiMaggio, Paul, Manish Nag, and David Blei. 2013. “Exploiting Affinities Between Topic Modeling and the Sociological Perspective on Culture: Application to Newspaper Coverage of U.S. Government Arts Funding.” Poetics 41 (6): 570–606.
Domingos, Pedro. 2015. The Master Algorithm: How the Quest for the Ultimate Learning Machine Will Remake Our World. Basic Books.
Dressel, Julia, and Hany Farid. 2018. “The Accuracy, Fairness, and Limits of Predicting Recidivism.” Science Advances 4 (1): eaao5580.
Grimmer, Justin, Margaret E Roberts, and Brandon M Stewart. 2021. “Machine Learning for Social Science: An Agnostic Approach.” Annual Review of Political Science 24 (1): 395–419.
Heyman, Richard E, and Amy M Smith Slep. 2001. “The Hazards of Predicting Divorce Without Crossvalidation.” Journal of Marriage and the Family 63 (2): 473–79.
James, Gareth, Daniela Witten, Trevor Hastie, and Robert Tibshirani. 2013. An Introduction to Statistical Learning: With Applications in R. Springer.
Lingam, Greeshma, Rashmi Ranjan Rout, Dvln Somayajulu, and Sajal K Das. 2020. “Social Botnet Community Detection: A Novel Approach Based on Behavioral Similarity in Twitter Network Using Deep Learning.” In Proceedings of the 15th ACM Asia Conference on Computer and Communications Security, 708–18. Association for Computing Machinery.
Marcus, Gary, and Ernest Davis. 2019. Rebooting AI: Building Artificial Intelligence We Can Trust. Knopf Doubleday Publishing Group.
Martínez-Cámara, Eugenio, M Teresa Martín-Valdivia, L Alfonso Ureña-López, and A Rturo Montejo-Ráez. 2014. “Sentiment Analysis in Twitter.” Natural Language Engineering 20 (1): 1–28.
McFarland, Daniel A, Daniel Ramage, Jason Chuang, Jeffrey Heer, Christopher D Manning, and Daniel Jurafsky. 2013. “Differentiating Language Usage Through Topic Models.” Poetics 41 (6): 607–25.
Metz, Cade. 2022. Genius Makers: The Mavericks Who Brought AI to Google, Facebook, and the World. Penguine Random House.
Mohr, John W, and Petko Bogdanov. 2013. “Introduction—Topic Models: What They Are and Why They Matter.” Poetics 41 (6): 545–69.
Molina, Mario, and Filiz Garip. 2019. “Machine Learning for Sociology.” Annual Review of Sociology.
Molnar, Christoph. 2022. “Interpretable Machine Learning.” https://christophm.github.io/interpretable-ml-book/.
Roser, Max. 2022. “The Brief History of Artificial Intelligence: The World Has Changed Fast – What Might Be Next?” https://ourworldindata.org/brief-history-of-ai.
Rudin, Cynthia. 2019. “Stop Explaining Black Box Machine Learning Models for High Stakes Decisions and Use Interpretable Models Instead.” Nature Machine Intelligence 1 (5): 206–15.
Salganik, Matthew J, Ian Lundberg, Alexander T Kindel, Caitlin E Ahearn, Khaled Al-Ghoneim, Abdullah Almaatouq, Drew M Altschul, et al. 2020. “Measuring the Predictability of Life Outcomes with a Scientific Mass Collaboration.” Proceedings of the National Academy of Sciences of the United States of America 117 (15): 8398–8403.
Schwemmer, Carsten, and Sebastian Jungkunz. 2019. “Whose Ideas Are Worth Spreading? The Representation of Women and Ethnic Groups in TED Talks.” Political Research Exchange: An ECPR Journal 1 (1): 1–23.
Stoetzer, L F, M Neunhoeffer, T Gschwend, et al. 2019. “Forecasting Elections in Multiparty Systems: A Bayesian Approach Combining Polls and Fundamentals.” Political.
Sundararajan, K, L Garg, K Srinivasan, A K Bashir, J Kaliappan, G P Ganapathy, S K Selvaraj, and T Meena. 2021. “A Contemporary Review on Drought Modeling Using Machine Learning Approaches.” CMES - Computer Modeling in Engineering and Sciences 128 (2): 41.
Sundsøy, Pål, Johannes Bjelland, Bjørn-Atle Reme, Eaman Jahani, Erik Wetter, and Linus Bengtsson. 2017. “Towards Real-Time Prediction of Unemployment and Profession.” In Social Informatics, 14–23. Springer International Publishing.
Zand, Bernhard, Christoph Scheuermann, and D E R Spiegel. 2018. “Pedro Domingos on the Arms Race in Artificial Intelligence.” https://www.spiegel.de/international/world/pedro-domingos-on-the-arms-race-in-artificial-intelligence-a-1203132.html.
Footnotes
“It is a field of research in computer science that develops and studies methods and software that enable machines to perceive their environment and use learning and intelligence to take actions that maximize their chances of achieving defined goals.” (Wikipedia, 10.2.2025); “the effort to automate intellectual tasks normally performed by humans” (Chollet and Allaire 2018, 2) (includes chess computers!)↩︎
“a specific subfield of AI that aims at automatically developing programs (called models) purely from exposure to training data. This process of turning models data into a program is called learning.” (Chollet and Allaire 2018, 307)↩︎
“Application of machine learning methods to large databases is called data mining. The analogy is that a large volume of earth and raw material is extracted from a mine, which when processed leads to a small amount of very precious material; similarly, in data mining, a large volume of data is processed to construct a simple model with valuable use, for example, having high predictive accuracy.” (Alpaydin 2014, 2)↩︎
Different actors with varying interests, often summarized under the term “competition.” In their daily lives, individuals simply want AI to work, i.e., simplifies their life (though they are often unaware that AI is working in the background).↩︎
Quote by Margaret Mitchell, a founding member of Microsoft’s “cognition” group↩︎
Stop explaining black box machine learning models for high stakes decisions and use interpretable models instead (Rudin 2019); Interpretable to Whom? A Role-based Model for Analyzing Interpretable Machine Learning Systems↩︎
“A generative adversarial network (GAN) is a class of machine learning frameworks and a prominent framework for approaching generative artificial intelligence. […] In a GAN, two neural networks contest with each other in the form of a zero-sum game, where one agent’s gain is another agent’s loss.” (Wikipedia, 10.2.2025)↩︎
Clustering: a technique for grouping units into inductively determined, mutually exclusive, and exhaustive sets; Admixture: similar to cluster analysis but representing each unit with a set of proportions (nonnegative weights that sum to one) that represent membership across all clusters; Embedding: mapping of units to a low-dimensional, real-valued vector that contains information about the unit; Fictitious prediction problem: a prediction problem where the goal is to learn the features that enable prediction; the predictions themselves are not of interest↩︎
In latter case we would add a variable \(\text{time }T\) to our dataset↩︎